[Seaborn] 10. stripplot
1. stripplot 기본
sns.stripplot(data=df)

2. 컬럼 입력
sns.stripplot(data=df, x='반', y='국어')
- 컬럼 입력하면 범주형 구분해서 y값 분포를 보여준다.

3. 그룹화
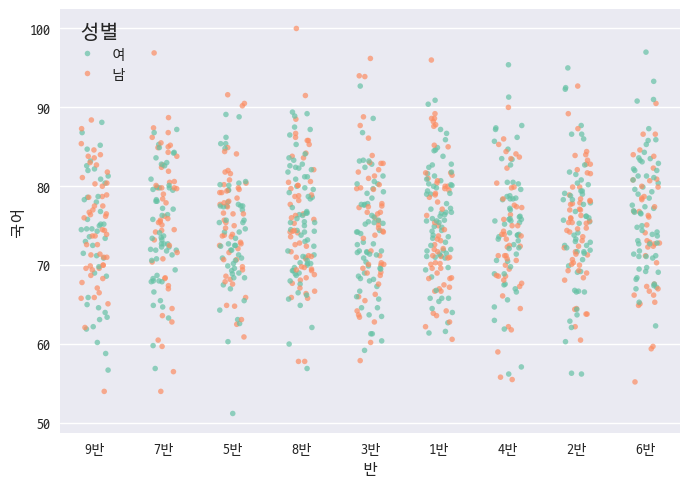
sns.stripplot(
    # 기본 데이터 설정: 데이터프레임 / X축 / Y축 / 색상구분
    data=df, x='반', y='국어', hue='성별',

    # 스타일 설정: 점크기 / 투명도 / 팔레트 / 지터량
    size=4, alpha=0.5, palette='Set2', jitter=0.2
)
- jitter를 추가해서 데이터가 좌우로 산포되어있는 것을 조정할 수 있다.
- 0.2도 넓다 싶으면 줄이기.
4. strip + box
# 박스플롯 먼저 그리기
sns.boxplot(
    # 기본 데이터 설정: 데이터프레임 / X축 / Y축
    data=df, x='반', y='국어',

    # 스타일 설정: 투명도 / 색상
    color='lightgray',

    # 박스 설정: 너비
    width=0.5
)

# 그 위에 스트립플롯 추가
sns.stripplot(
    # 기본 데이터 설정: 데이터프레임 / X축 / Y축 / 색상구분
    data=df, x='반', y='국어', hue='성별',

    # 스타일 설정: 점크기 / 투명도 / 팔레트 / 지터량
    size=4, alpha=0.5, palette='Set2', jitter=0.1
)

plt.title('반별 국어 점수 분포', pad=15)
- box + strip으로 데이터 분포 + 사분위수 같이 보기

정리
sns.stripplot(
    # 기본 데이터 설정: 데이터프레임 / X축 / Y축 / 색상구분
    data=df, x='col1', y='col2', hue='col3',

    # 스타일 설정: 점크기 / 투명도 / 팔레트
    size=4, alpha=0.5, palette='muted',

    # 분산 설정: 가로 흔들림 정도
    jitter=0.2
)
{
    "Seaborn Stripplot Template": {
        "prefix": "sns_strip",
        "body": [
            "sns.stripplot(",
            "    # 기본 데이터 설정: 데이터프레임 / X축 / Y축 / 색상구분",
            "    data=${1:df}, x='${2:col1}', y='${3:col2}', hue='${4:col3}',",
            "",
            "    # 스타일 설정: 점크기 / 투명도 / 팔레트",
            "    size=${5:4}, alpha=${6:0.5}, palette='${7:Set2}',",
            "",
            "    # 분산 설정: 가로 흔들림 정도",
            "    jitter=${8:0.2}",
            ")"
        ],
        "description": "Create a Seaborn stripplot with common parameters"
    }
}


댓글